

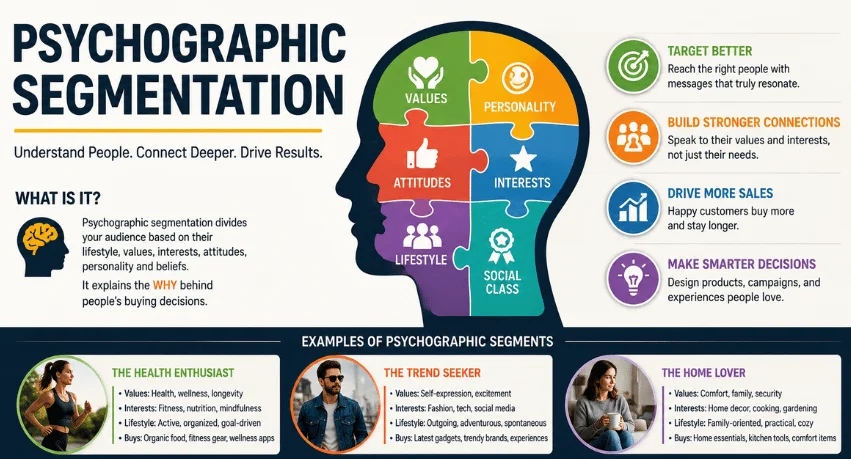
Two people earn the same salary, live on the same street, and buy completely different running shoes. Demographics cannot explain that gap. Psychographic segmentation can, because it sorts buyers by what they value and want rather than by what they look like on a spreadsheet.
Below is the honest version: what these traits measure, how you gather the data yourself, and the points where the method quietly fails.
| Psychographic | Short answer |
| What it sorts people by | Values, attitudes, interests, personality, lifestyle, and social class |
| What it cannot tell you | Who someone is on paper, or what they have already bought |
| Where the data comes from | Customer interviews, surveys, review mining, your own first party records |
| Cost to run it yourself | Gift cards and a weekend, or roughly $25 to $75 per interview participant |
| Sample size worth defending | 200 or more survey responses per segment |
| Biggest weakness | Self-reported values predict behavior weakly. |
| Rules to check first | State privacy laws on consent, sensitive data, and opt-out rights. |
TL;DR key takeaways
- Demographics say who. Behavior says what happened. Attitudes and values try to say why.
- You can collect the data with 10 customer interviews, one short survey, and a pile of existing reviews.
- Segments drift. Refresh them every 12 to 18 months, or sooner after a price change.
- Treat VALS and similar frameworks as useful shorthand, not proof.
- Inferences about a person count as personal data in several states, so consent matters.
What Is Psychographic Segmentation?
Psychographic segmentation is a marketing method that groups customers according to what they value, believe, feel, and enjoy, rather than relying only on demographic details such as age, income, or location. It can include personality, values, attitudes, interests, lifestyle, and social status.
By understanding these motivations, businesses can create more relevant products, messages, and offers for different customer groups. Unlike behavioral segmentation, which records what customers have already done, psychographic segmentation focuses on the reasons and motivations behind their choices.
What these traits measure
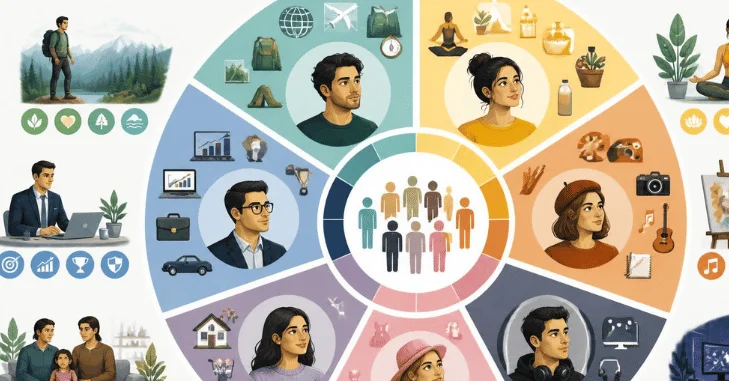
Most teams break the data into five buckets. None of them is a personality test score. They are working labels for the things that move a purchase.
- Personality: steady dispositions, like appetite for risk or hunger for novelty.
- Values: what a buyer treats as non-negotiable, such as thrift or sustainability.
- Attitudes and opinions: how they feel about your category, your brand, or the issue behind it.
- Lifestyle, often called AIO: activities, interests, and opinions, is the classic survey battery.
- Social class and status: the group a buyer places themselves in, which can matter more than income.
Emotion sits underneath all five. Someone who feels behind their friends shops differently from someone who feels settled, even on identical pay. For a plain walkthrough of how a single feeling steers a choice, this breakdown of envy in Inside Out 2 makes the mechanism easy to see.
Demographic, psychographic, and behavioral cuts of one buyer
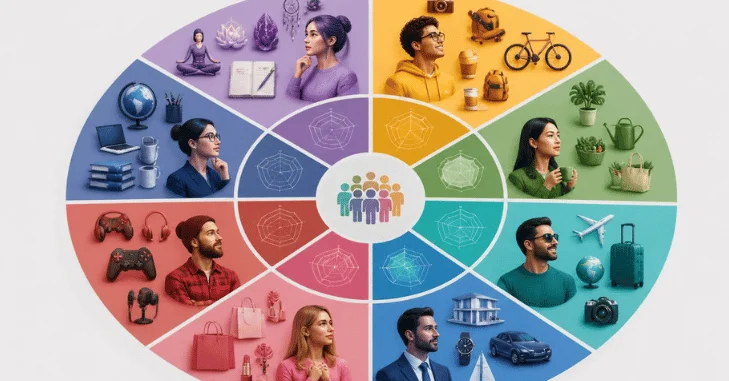
Abstract definitions blur together. So take one product, a $130 pair of running shoes, and one customer, and slice her three ways.
| Cut | What it says about her | What you do with it |
| Demographics | Woman, 34, Denver, household income near $95,000, no kids | Set the price tier and buy media by age and metro. |
| Psychographics | Running is her stress valve, not a sport. She distrusts brands that talk about race times. She wants gear that lasts. | Drop the podium imagery. Sell durability and calm. Sponsor a group run, not a marathon. |
| Behavior | Two pairs in 18 months, both bought in January, both on discount | Time for the January email. Cap the discount before she trains herself to wait. |
Read the rows again, and the division of labor is obvious. Demographics find her. Behavior records what she did. The middle row is the only one that tells you what to say.
Money choices split the same way. Two shoppers with matching incomes look at a store card and see opposite objects: one sees a discount worth taking, the other a trap with a bow on it. Skim the fees on a Maurices Credit Card, and you can watch both readings hold up at once.
How to collect the data without a big budget
Most articles on this topic list the variables and stop there. Collection is the part that decides whether your segments mean anything, and it takes three passes.
- Interview 8 to 12 customers first. You are hunting for language, not numbers. Three prompts carry most of the work:
- Walk me through the last time you bought something like this.
- What would have to change for you to stop buying it?
- Who did you tell about it, and what did you say to them?
- Survey second, to size what you heard. Keep it to 10 to 15 questions and under five minutes. Three item types cover attitudes:
- An agree or disagree scale: I will pay more for a brand whose values match mine.
- A ranking item: put these five factors in the order you weigh them.
- One open text box: What is the hardest part of this for you right now?
- Mine the reviews you already have. Pull 200 reviews, support tickets, and refund requests. Tag every clause containing “because,” “so that,” or “I wish.” Those clauses are motivation, written by customers, at no cost.
A small business can run all three for the price of gift cards. Expect roughly $25 to $75 per interview participant, plus a few hours of tagging. An enterprise panel study with a national sample lands in five figures, and the extra spend buys statistical confidence rather than better questions.
Aim for at least 200 survey responses per segment you intend to defend in a meeting. Below that, you have anecdotes with a chart on top.
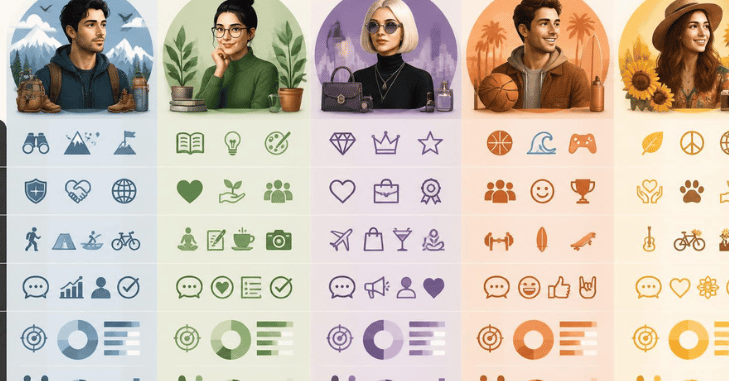
Three segments you can see in real markets
Fast casual food. The performance eater counts protein and reads the ingredient board. The convenience eater wants a hot meal in seven minutes and treats the menu as a formality. Same burrito, two different reasons, and rivals chase both with different promises. That contest is visible in this look at how Chipotle stacks up against its competitors on price and satisfaction.
Apparel. The frugal identity shopper takes pride in never paying full price and will tell you the discount she got before she tells you the brand. The treat shopper buys to mark something: a new job, a hard month survived. Discount codes delight the first and cheapen the purchase for the second.
Software. Early adopters want to be the person who found the tool. Late holdouts want proof that nobody got fired for choosing it. One group reads changelogs, and the other reads case studies from companies that look like theirs.
Where the approach breaks down
Here is the part the ranking pages skip.
- Self-reported values are weak predictors. There is a well-documented gap between the attitude people report and the behavior they show, and social desirability bias widens it. Buyers describe themselves as greener, more data-driven, and more disciplined than their receipts suggest. Cross-check every survey finding against something a customer did.
- Segments drift. Attitudes move with prices and life stages. Refresh your segments every 12 to 18 months, and re-run the work early after a price change, a new competitor, or a product launch.
- Frameworks are shorthand, not physics. VALS is a proprietary framework, and using it properly means using its official instrument and scoring. Its critics point to face validity limits and to a plainer problem: it maps motivation to likely behavior without showing that those motives cause the purchase. Borrow the vocabulary, and hold the conclusions loosely.
- Test whether your segments differ at all. Run the same message past two of them. If both respond the same way, you have one segment and two names for it.
What US privacy rules allow
Attitude data is regulated. Under California law, inferences drawn about a person count as personal information, so a “values” score you calculate is covered the same as an email address.
Three practical limits shape this work now:
- Sensitive categories, including health inferences and precise location, need opt-in consent in most states with a privacy law.
- Handing customer data to an ad platform to build a lookalike audience counts as sharing, even when no money changes hands.
- California’s automated decision-making rules took effect on January 1, 2026, and require a pre-use notice plus an opt-out when software makes significant decisions about people.
First-party research stays the safest ground. If a customer answered your survey and knows why you asked, you are on solid footing. Buying inferred attitude scores from a broker is where the risk sits.
Conclusion
Psychographic segmentation helps businesses move beyond basic demographics and understand why customers make their buying decisions. By studying values, attitudes, interests, personality, and lifestyle, you can create more relevant messages and offers for different customer groups.
The strongest approach combines customer interviews, surveys, reviews, and real purchasing behavior rather than relying on self-reported preferences alone. Keep segments simple, test whether they actually respond differently, and refresh them as customer needs change. Used carefully, psychographic segmentation can turn customer motivations into clearer marketing decisions without treating assumptions as facts.
Your next step
Book three customer calls this week. Ask the three interview questions above, write down the exact words people use for their problem, and put those words in your next campaign. That is a working segment, built in an afternoon, before you spend a dollar on panel research.
FAQs
Directionally, yes. As a prediction of what one person will do next, no. Treat it as the explanation layer on top of behavior you can measure, and never as a substitute for it.
Behavior records actions: purchases, visits, and cancellations. Attitudes and values explain the reasoning behind those actions. One is a receipt; the other is a motive.
Three to five for most companies. Every segment needs its own messaging, and teams rarely maintain more than five without letting some go stale.
No. Analytics shows what happened on your site. Values, worries, and self-image come from talking to people or from what they wrote in reviews.
Yes, with a shift in focus. Buyer attitudes toward risk, career exposure, and internal politics drive more B2B deals than feature lists do.